Arguably, one of the greatest challenges confronting the U.S. cannabis industry is the continued pressure from a thriving illicit market. Consequently, same-store top line increases have generally been insignificant and near- term consensus revenue growth projections seem negligible. The implementation of new state markets and eventual federal legalization will lead to substantial upside (~$27B market size today to ~ $90B at maturity).
Nonetheless valuation metrics remain lower for cannabis businesses than for well established, mature industries (i.e. Big Tobacco, Alcohol and Pharma), but without effective law enforcement, a regulated cannabis market will remain inhibited, in our view.
In May, 2022 we reviewed and analyzed cannabis seizures/plant eradication statistics published by the Department of U.S. Customs and Border Protection and the U.S. Drug Enforcement Agency. This information reveals a measurable component of the illicit market and is updated to include activity for CYE 2022 and FYE Sept 30 (where applicable).
The purpose of this exercise was to determine a reasonable basis upon which we can establish a floor value of illicit sales in the U.S. and from which we can benchmark to subsequent periods.
KEY TAKEAWAYS:
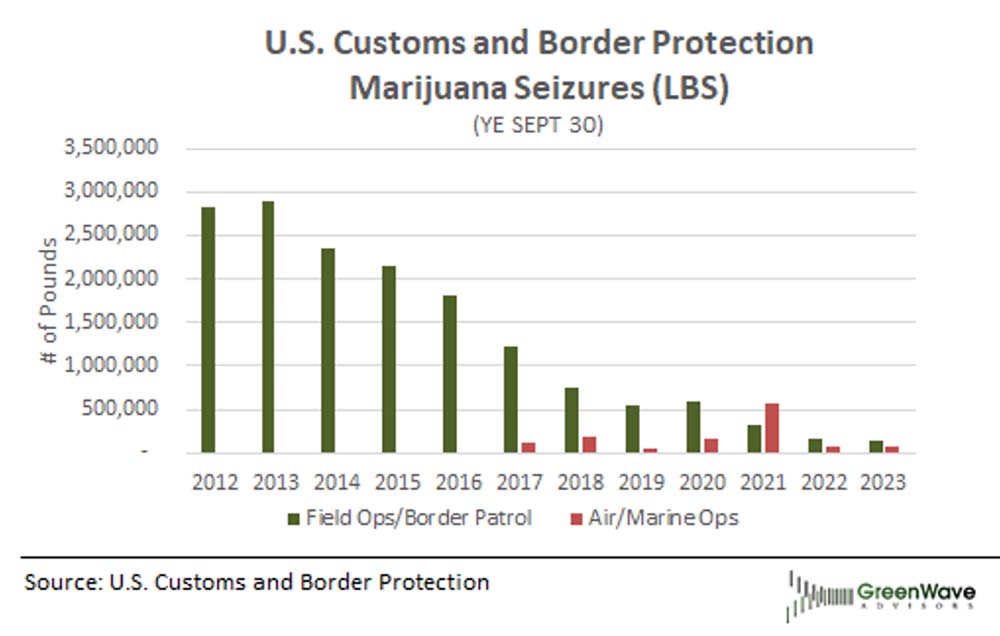
- Seizures at U.S. borders have decreased significantly over the past decade likely because drug cartels are unable to compete with legal state markets.
- Conversely, there has been a heightened level of enforcement by the DEA within U.S. borders since the COVID pandemic. Demand through illicit channels remains strong as it provides a less expensive alternative for the price-sensitive consumer.
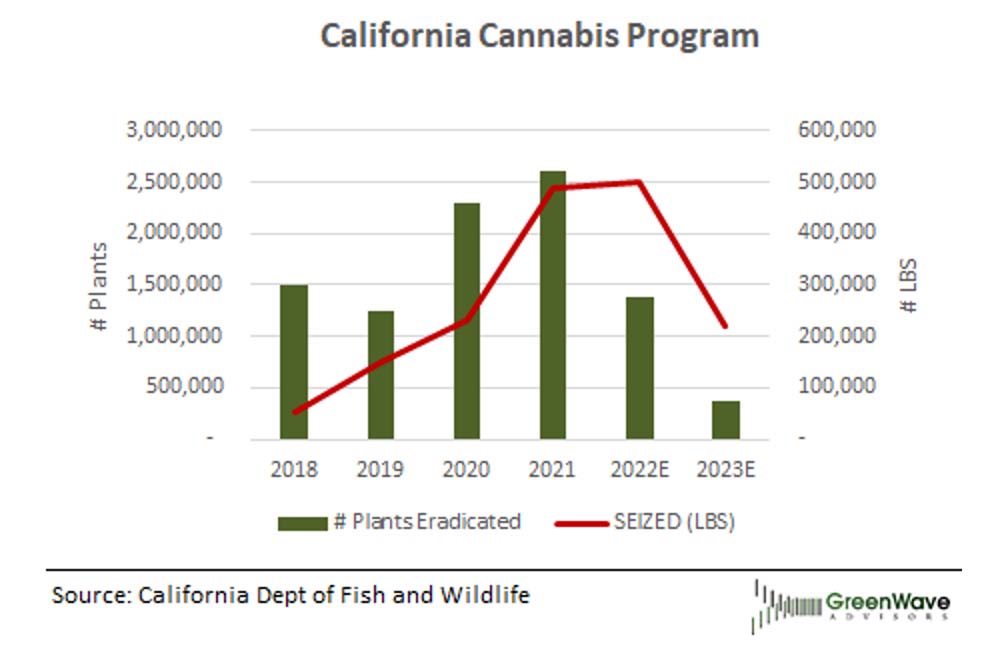
- Individual state and local enforcement programs continue to shut down illicit activities, with California among the most significant.
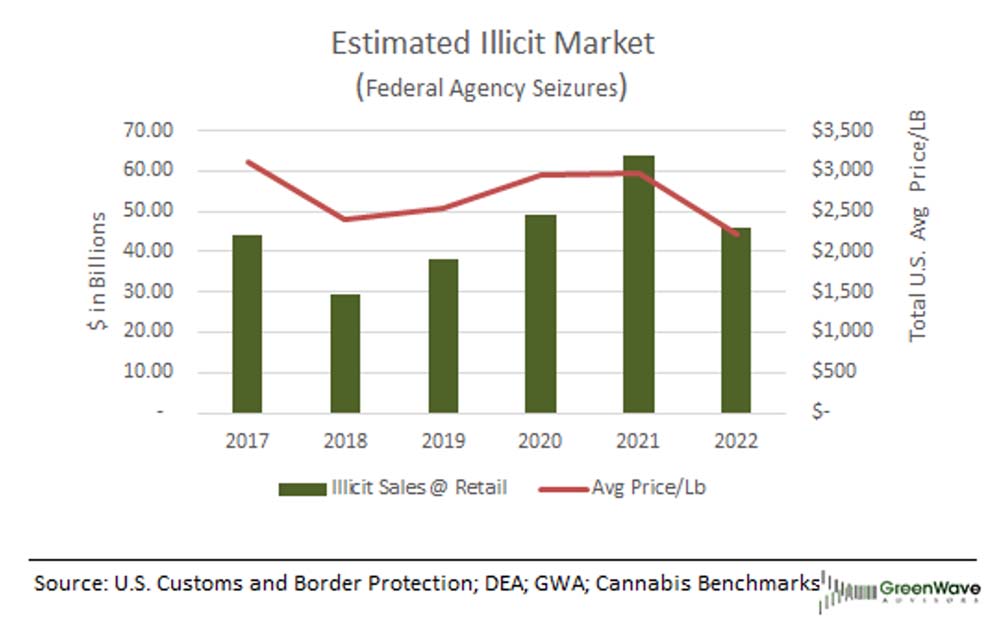
- We determined a floor value of the U.S. illicit market at ~$45B based upon 2022 federal agency activity (Customs and Border Protection and DEA); this amount excludes individual state and local enforcement programs.
- We determined a floor value for the California illicit market of ~ $8.9B based upon statistics reported by its Department of Fish and Wildlife.
Full Article:
DETAILS:
1) Seizures at U.S. borders have decreased significantly over the past decade. The obvious reason we believe, is that the Mexican (and other) drug cartels have moved on from smuggling Marijuana into the U.S. as legal state markets have opened. As the chart illustrates, seizures at the U.S. borders began to lessen in 2014 when Colorado implemented recreational use cannabis alongside its existing medical marijuana program.
2) There has been a heightened level of enforcement by the DEA since the COVID pandemic. The DEA’s Domestic Cannabis Eradication/Suppression Program is “the only nationwide law enforcement program that exclusively targets Drug Trafficking Organizations (DTO) in illegal cannabis cultivation.”
As illustrated below, activity spiked during the COVID pandemic (2020-21) with an increase in both plant eradications and seizures of bulk processed marijuana. We believe the uptick could be attributed to an increased demand for illicit product because it provides a less expensive alternative to price-sensitive consumers, particularly in the wake of looming economic uncertainty. We note that ~85% of the DEA enforcement has been within California.
3) Individual state and local enforcement programs continue to shut down illicit activities, with California among the most significant. As illustrated below, the state also experienced an uptick in activity during the COVID pandemic.
4) We determined a floor value of the U.S. illicit market at ~$45B based upon 2022 federal agency activity (Customs and Border Protection and DEA) and excludes individual state and local enforcement programs.
Our methodology and assumptions are based upon limited available information. Nonetheless where possible, we erred on the side of conservatism:
- 1 plant produces 1 pound of cannabis.
- The average retail price per pound is 2x the wholesale price (full year average price/pound in the U.S. per Cannabis Benchmarks).
- Total illicit sales per year based upon a 3x multiplier (total U.S much higher if we include enforcement at the state/local level).
- All plants/seizures used for flower and excludes other form factors.
5) We also determined a floor value for California at $8.9B based upon statistics reported by its Department of Fish and Wildlife. Our assumptions parallel our federal analysis with the exception of wholesale pricing in which we used the California full year average (per Cannabis Benchmarks).


